Articles
From the moment shale oil and gas technologies emerged, the landscape of the U.S. energy sector has undergone swift and significant transformations. This evolution shines a spotlight on numerous advancements, especially when visualized on an industry-wide map. At Rextag, we go beyond merely highlighting significant projects like the commissioning of pipelines or LNG terminals. We recognize the importance of all news, whether it’s the drilling of new wells or the scheduled maintenance of processing facilities.
Though daily advancements may go unnoticed, we invite you to track these developments alongside us. Our primary objective is to anchor this information onto specific maps, be it maps of crude oil refineries or natural gas compressor stations. Where do you usually gather your crucial industry news? Perhaps you're engaged with your favorite social media platforms or subscribed to specific industry publications. Your quest, in essence, is for the story—the developments, the architects behind them, and their implications. It's essential to remember, the driving question always relates to the 'What’s in It For Me' (WIIFM) principle.
How does our article aid your understanding? Our strategy is twofold: examining the details "up close" and offering a "wider view" of the scenario.
"Up close" examination clarifies the precise location of interest.
A "wider view" helps you comprehend the broader context.
Imagine a new power plant being erected in the North-East—our articles enable you to see not just the plant but also the specific transmission lines that connect to it and their paths. What about the presence of other power plants nearby? Our GIS data isn't just a solitary point on a map; it includes extensive additional details such as ownership, operational data, physical parameters, and production statistics. Sometimes, you might find exclusive area maps shared in our articles, often with rich, underlying data. Ever wondered who the top midstream operators in the Permian are this year? Or the extent of Kinder Morgan’s pipeline mileage in the San-Juan basin? If these questions pique your interest, you’ve found the right place.
Let’s delve into WHERE these developments are taking place. Engage with our articles, visualize the mapped energy infrastructure, and stay informed with Rextag data!
Advancements in Natural Gas Pipeline Leak Detection Technologies

Discover advancements in natural gas pipeline leak detection technologies, enhancing safety, reducing emissions, and improving economic efficiency with recent data.
Renewable Natural Gas from Agricultural Waste: Case Studies
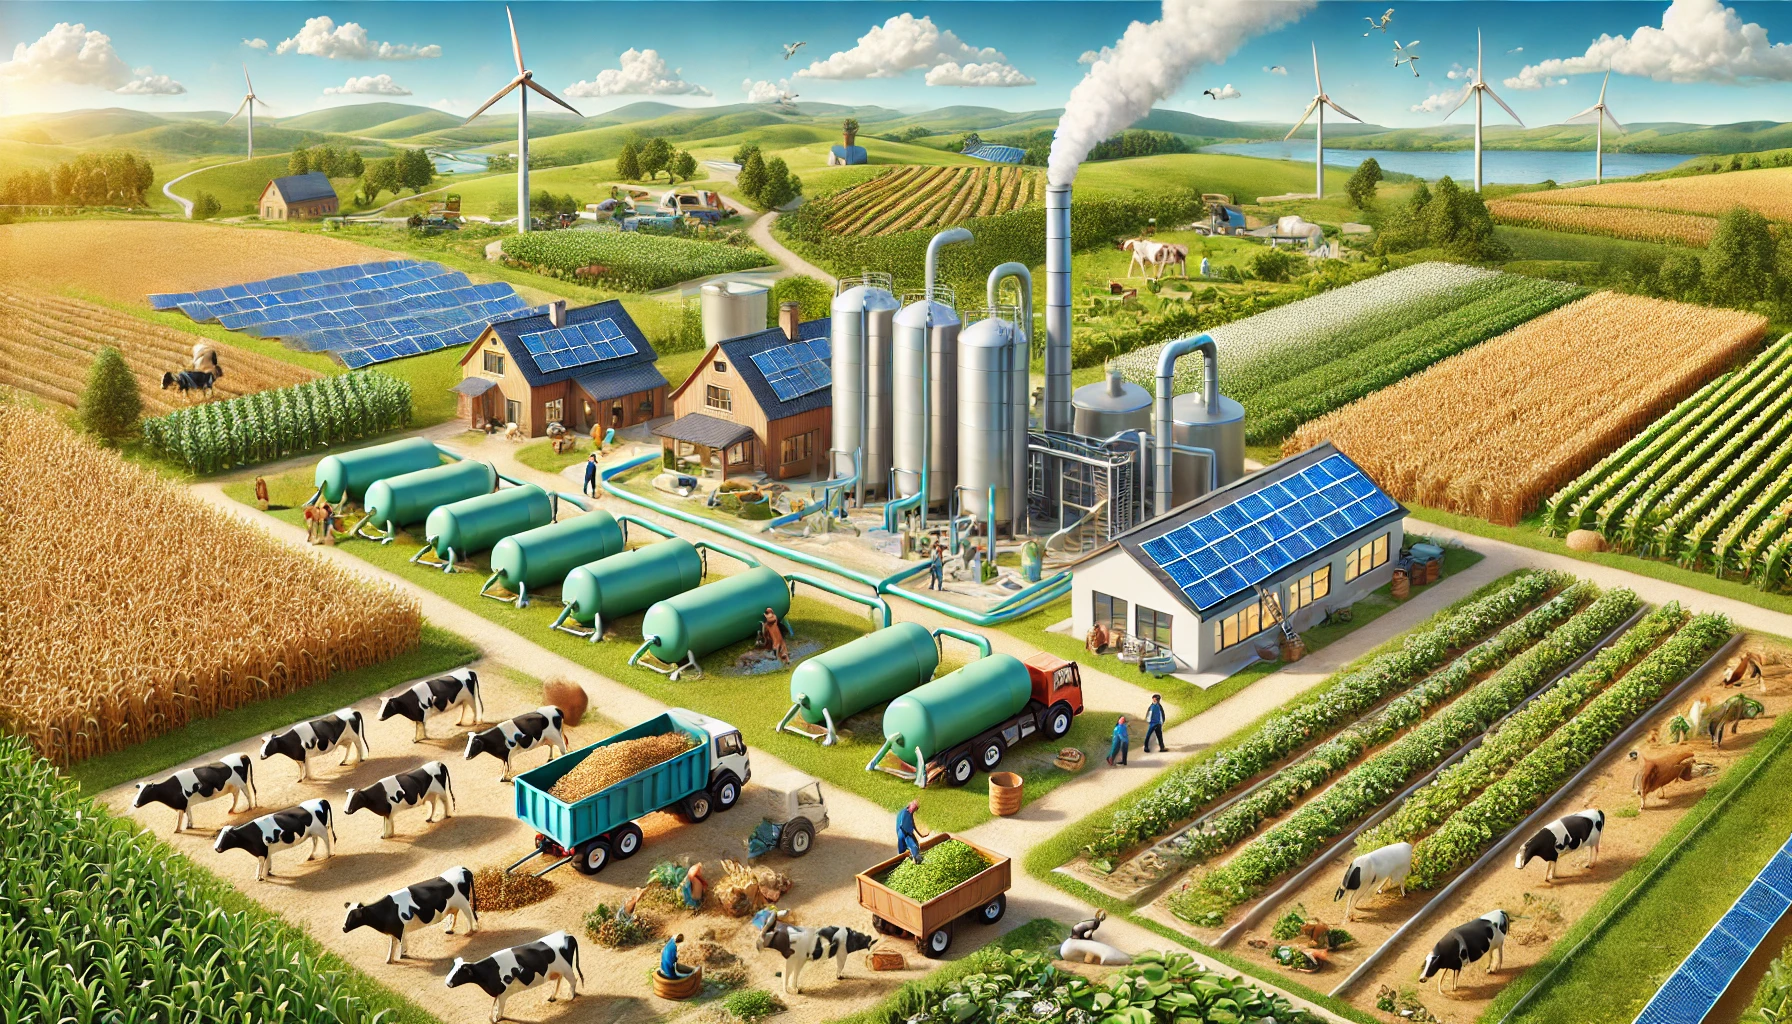
Discover how Renewable Natural Gas (RNG) from agricultural waste is transforming energy production with case studies and latest data on environmental and economic benefits.
The Impact of New LNG Export Facilities on U.S. Natural Gas Prices

Natural gas has become a cornerstone of the U.S. energy sector, providing a cleaner alternative to coal and serving as a key resource for electricity generation, industrial use, and heating.
Natural Gas Demand: Trends, Challenges, and the Path Forward

Explore the trends, challenges, and future of natural gas demand in this insightful and easy-to-read article.
Regulatory Shifts in Natural Gas: What New Policies Mean for the Industry

As the world tackles climate change and energy security issues, the natural gas industry finds itself at a pivotal point.
From Shale to Ship: How the US Became the World's Leading LNG Exporter

Explore how the US leveraged shale gas, technology, and investment to become the world's top LNG exporter, shaping global energy dynamics.
Navigating Through the Fog: The Impact of Price Volatility on the Natural Gas Market

Recent years have seen significant fluctuations in natural gas prices, impacting economies, policy-making, and strategic decisions within the energy sector.
The Global Landscape of Compressed Natural Gas: Adoption and Innovations

As nations grapple with the pressing need to mitigate climate change, the adoption of CNG has gained momentum, marked by significant investments in infrastructure and technology.
An In-Depth Analysis of Natural Gas Market Indicators: Key Statistics and Metrics for Analyzing the Industry

The natural gas market indicators, industry analysis, energy market statistics, natural gas metrics, and market trends are crucial components that provide valuable insights into the complex world of the natural gas industry.